canadian-weather
Canadian Historical Weather Data
Prepared by Nathan K. Chan
Project website: https://nathankchan.github.io/canadian-weather/
GitHub repository: https://github.com/nathankchan/canadian-weather
Online application: https://nathankchan.shinyapps.io/canadian-weather/
Overview
This project is an interactive Shiny web application for exploring historical hourly weather data across all 13 Canadian provinces and territories. Data is sourced from Environment and Climate Change Canada (ECCC) and covers 960 active weather stations.
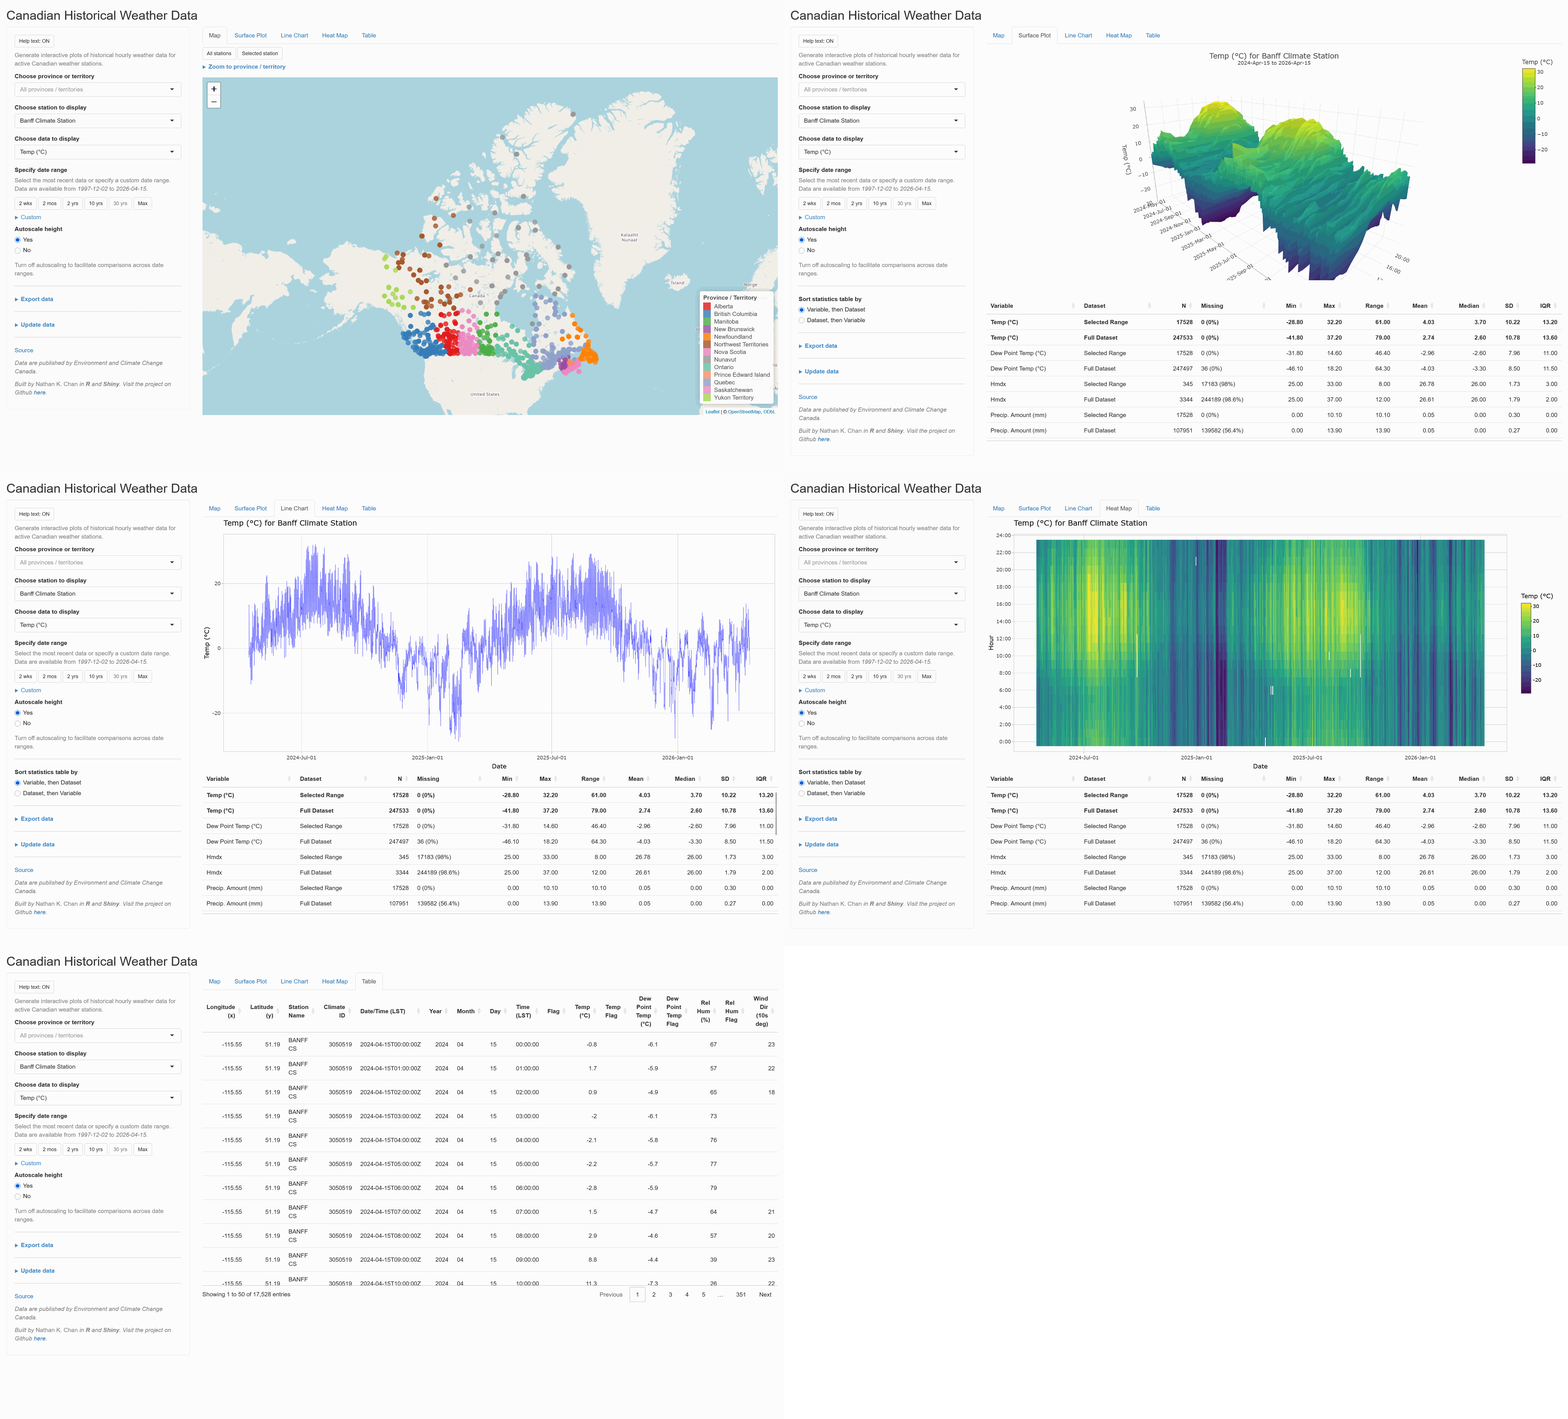
Browse the data through five views: Map, Surface Plot, Line Chart, Heat Map, and Table.
Requirements
R 4.5.3 is required. If it is not installed, visit r-project.org.
Dependencies are managed with renv. Key packages include:
- tidyverse — data wrangling
- arrow — Parquet I/O and lazy dataset queries
- shiny — interactive web application framework
- plotly — interactive plots
- DT — interactive data table
- leaflet — interactive station map
- shinycssloaders — loading spinners
Restore the full dependency lockfile before running:
renv::restore()
Running Locally
1. Build the data pipeline
pipeline.R is the data pipeline script. It:
- Updates station metadata from the ECCC inventory
- Downloads raw hourly CSVs per station
- Removes stale and corrupted files
- Converts all CSVs to Parquet format
cd {project_dir}
Rscript pipeline.R
The initial download covers 960 stations and may take several hours. Subsequent runs only fetch new or updated files and complete in minutes.
2. Launch the app
cd {project_dir}
Rscript app.R
Then open the printed URL (e.g. http://127.0.0.1:{port}) in a browser. Press Ctrl+C to stop the app.
Data Flow
ECCC API → pipeline.R → rawdata/{StationID}/*.csv
    → pipeline.R (combine CSVs, drop missing rows, type-convert, write Parquet)
    → data/{StationID}.parquet
    → app.R (lazy Arrow dataset, date-range filtered)
    → Shiny UI (Map / Surface Plot / Line Chart / Heat Map / Table)
The app opens each station’s Parquet file lazily via arrow::open_dataset() and only collects data after applying the selected date-range filter — no full dataset is loaded into memory.
App Features
- Province / territory filter — narrows the station list to a single province or territory, or shows all 960 stations
- Station selector — choose any active ECCC station
- Column selector — choose any numeric measurement column (e.g. temperature, dew point, wind speed)
- Date range picker — restrict the view to any date range within the station’s record; six preset buttons (2 wks, 2 mos, 2 yrs, 10 yrs, 30 yrs, Max) or a custom date range / slider
- Autoscale toggle — fix the value axis range for consistent comparisons across date ranges
- Statistics table — shown below each plot tab; compares summary statistics (N, Min, Max, Mean, SD, etc.) for the selected date range against the full station dataset
- Export data — download the selected date range or full station dataset in CSV or Parquet format
- Update source data — update the selected station or all stations from ECCC directly within the app
- Help text toggle — show or hide contextual help throughout the interface
- Five tabs:
- Map — interactive leaflet map of all stations, colour-coded by province; click any marker to load that station; zoom to a province or territory with one click; zoom to selected station or all stations
- Surface Plot — 3D surface of the selected variable over time-of-day vs date
- Line Chart — hourly time series line plot
- Heat Map — heatmap of hour-of-day vs date
- Table — paginated, scrollable data table